Price moves in up or down direction, with time. The movements are accomplished by the creation of buying and selling pressures. Over time periods, the price moves in certain patterns, thus the name, price patterns.
- Patterns are the foundation of technical analysis.
- A pattern is identified by a line that connects common price points, such as closing prices or highs or lows, during a specific period of time.
- We seek to identify patterns as a way to anticipate the future direction of a stock’s price.
- These patterns can be as simple as trendlines and as complex as double head-and-shoulders formations.
Trendlines
Continuation Patterns
If price continues on its trend, the price pattern is known as a continuation pattern. Common continuation patterns include:
- Pennants, constructed using two converging trendlines
- Flags, drawn with two parallel trendlines
- Wedges, constructed with two converging trendlines, where both are angled either up or down
Pennants
Pennants are price patterns that get constructed using two trendlines, converging to one point. The two trendlines move in opposite directions, ie one moves in a downtrend, while the other in an uptrend. A key characteristic of pennant formation is that, the volume decreases during its formation and the volume spikes when the pennant pattern is broken, i.e., when the price breaks out.

Flags
Flags are a price pattern that get created when the two trendlines move parallelly. Now these trendlines can move up or down or even sideways. They are basically a pause in the movement of the main price trend. Hence, if we have a flag going downward, it is a pause, in an up trending market. When the flag is inclined upwards, it is a pause, in a down trending market. Hence, after the pause the price breaks from the flag and moves in the direction of the main or the original trend. The volume decreases while the flag is created and the volume recovers as the price breaks out of the flag.

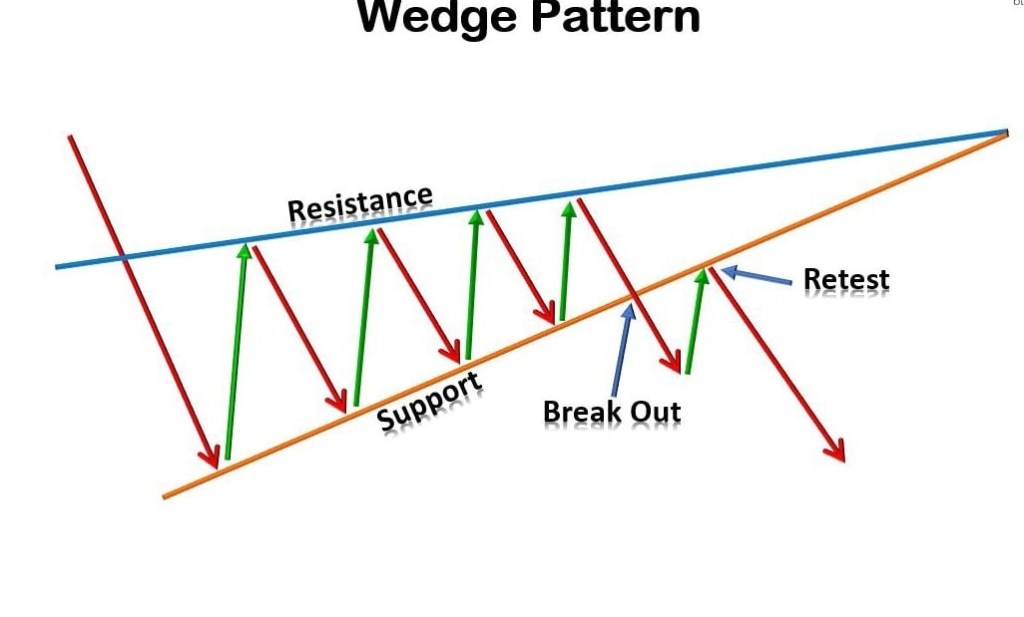
Wedges
Wedges are similar to pennants. They are constructed using two converging trendlines; however, a wedge is characterized by the fact that both trendlines are moving in the same direction, either up or down. A wedge that is angled down represents a pause during a uptrend; a wedge that is angled up shows a temporary interruption during a falling market. As with pennants and flags, volume typically tapers off during the formation of the pattern, only to increase once price breaks above or below the wedge pattern.
Triangles
Triangles are made by two trend lines, not necessarily converging. Hence, there are three types of triangles that get formed due to price action.
Symmetrical Triangles -Symmetrical triangles occur when two trend lines converge toward each other and signal only that a breakout is likely to occur—not the direction
Ascending Triangles – They are formed when one trend line (upper line) is flat and the other (lower line) is moving upwards (ascending). In this case the breakout higher is likely.
Descending Triangles – They are made when the lower trend line is flat and the upper trend line is descending (converging) towards the flat bottom line. The breakout in this case is likely lower.


